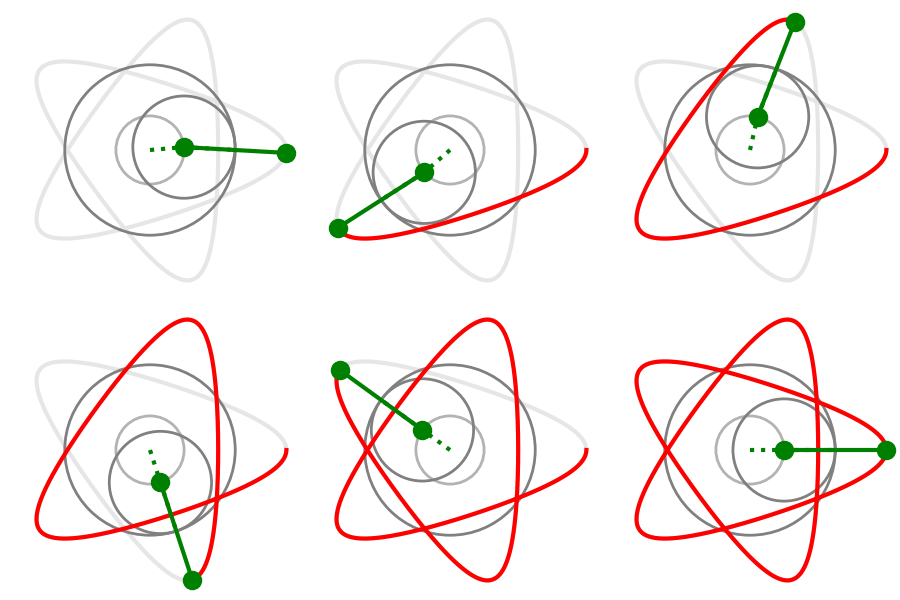
Preview of some spinny graphics
I’ve been working on the math behind some of my favorite graphics. You know, the spinny kinds that are produced by Spirograph toys and laser shows. The math turns out to be quite interesting. I’ve been learning a lot about Matplotlib in the process. (It’s the Python software library that I used to help me make the animations below.)
For now, have a teaser.
Animation of the mechanics drawing a hypotrochoid:

Simulated oscilloscope art of a modified rose curve: